Tracing Hanging and Complicated GPU Kernels Down To The Source Code
Several months ago, we published a blog post about CUDA Core Dump: An Effective Tool to Debug Memory Access Issues and Beyond, introducing a powerful technique for debugging illegal memory access issues in CUDA kernels. This represented a significant milestone in GPU kernel debugging, as it enables developers to pinpoint the exact kernel responsible for a failure. Previously, due to the asynchronous nature of GPU execution, identifying the problematic kernel was nearly impossible, and error messages were often misleading.
As adoption of the CUDA core dump technique has grown, developers have expressed a need for more granular information—specifically, the exact line of source code that triggered the issue. In this blog post, we address this gap by first covering how to identify hanging kernels, then demonstrating how to trace problematic kernels back to their source code.
How to find hanging kernels
GPU computational power has been increasing exponentially, but memory bandwidth has not kept pace. This imbalance has led to increasingly complex memory access patterns. In recent years, flagship datacenter GPUs have introduced asynchronous memory access patterns that require sophisticated synchronization when implementing high-performance kernels. These synchronization mechanisms are prone to race conditions and deadlocks, particularly in complex codebases.
When a GPU kernel hangs, the program typically freezes or becomes unresponsive—even pressing Ctrl-C cannot stop it. The most straightforward solution is to kill the process, but this approach provides no information about the root cause. Developers are left to guess blindly, bisecting code changes and running tests iteratively until they identify the issue.
Note
Why pressing Ctrl-C doesn’t stop the process when a CUDA kernel is hanging? Pressing Ctrl-C sends a SIGINT signal to the process. If the process is running Python code, the SIGINT signal is caught by the Python interpreter, which turns it into a KeyboardInterrupt exception and queues the exception to be handled after the process returns to run Python code. However, if the process is running a CUDA kernel and waiting for the GPU to finish, it is waiting for the low-level CUDA API to return, while no Python code is running, so the KeyboardInterrupt exception cannot be raised. In the following conditional_hang.py example, if you want to terminate the process via Ctrl-C, you need to add import signal; signal.signal(signal.SIGINT, signal.SIG_DFL) at the beginning of the script so that Python interpreter does not catch the SIGINT signal, then Ctrl-C can successfully terminate the process. The downside is Python interpreter will not be able to show the error stack when it is stopped by Ctrl-C.
Fortunately, there is a better way. The CUDA driver includes a feature called user induced GPU core dump generation: the driver opens pipes in the operating system that allow users to trigger a core dump by writing to them. When triggered, the CUDA driver dumps the GPU state to core dump files, enabling inspection of what’s happening inside the GPU and, most importantly, identifying which GPU kernel is hanging.
Consider a simple example of a conditional hanging kernel:
# save as conditional_hang.py

import triton
import triton.language as tl
import torch


@triton.jit
def conditional_hang_kernel(x_ptr,
                            flag,          # int32 scalar
                            n_elements,    # int32 scalar
                            BLOCK_SIZE: tl.constexpr):
    pid = tl.program_id(0)
    offs = pid * BLOCK_SIZE + tl.arange(0, BLOCK_SIZE)
    mask = offs < n_elements

    # Load values
    x = tl.load(x_ptr + offs, mask=mask, other=0)

    # If flag == 1: do a normal "+1" update
    if flag == 1:
        x = x + 1
        tl.store(x_ptr + offs, x, mask=mask)
    else:
        # Else: non-terminating loop, no break.
        # The loop condition depends on `flag`, which is invariant,
        # so this is effectively an infinite loop when flag == 0.
        while flag == 0:
            # do something trivial so the loop isn't optimized away
            x = x + 1
            tl.store(x_ptr + offs, x, mask=mask)


x = torch.ones(16, dtype=torch.float32, device="cuda")
n_elements = x.numel()
BLOCK_SIZE = 16


# 1) Normal behavior: increment by 1
conditional_hang_kernel[(1,)](
   x,
   flag=1,
   n_elements=n_elements,
   BLOCK_SIZE=BLOCK_SIZE,
)
print("After flag=1:", x)  # should be all 2s


# 2) Hanging behavior: this will spin forever
conditional_hang_kernel[(1,)](
   x,
   flag=0,
   n_elements=n_elements,
   BLOCK_SIZE=BLOCK_SIZE,
)

# this print will hang, because printing x will synchronize the device,
# and the kernel will never finish.

print("After flag=0:", x)

# the following line will never be reached

x = x + 2

torch.cuda.synchronize()
Executing this code will hang indefinitely. To debug the issue, we can enable user-induced GPU core dump generation:
CUDA_ENABLE_USER_TRIGGERED_COREDUMP=1 \
CUDA_COREDUMP_PIPE="/tmp/cuda_coredump_pipe_%h.%p.%t" \
CUDA_ENABLE_COREDUMP_ON_EXCEPTION=1 \
CUDA_COREDUMP_SHOW_PROGRESS=1 \
CUDA_COREDUMP_GENERATION_FLAGS='skip_nonrelocated_elf_images,skip_global_memory,skip_shared_memory,skip_local_memory,skip_constbank_memory' \
CUDA_COREDUMP_FILE="/tmp/cuda_coredump_%h.%p.%t" \
python conditional_hang.py
While the code is running indefinitely, we can trigger a CUDA core dump by writing to the pipe:
dd if=/dev/zero bs=1M count=1 > /tmp/cuda_coredump_pipe_hostname.3000837.1764236276
We write 1MB of zeros to the pipe to trigger the CUDA core dump. Note that a simple echo command might not work due to pipe buffering.
After triggering the core dump, the original terminal running python conditional_hang.py will display the core dump progress:
[01:39:15.256278] coredump: Writing ELF file to /tmp/cuda_coredump_hostname.3000837.1764236276
[01:39:15.256350] coredump: Writing out global memory (0 bytes)
[01:39:15.256354] coredump: Writing out device table
[01:39:15.292027] coredump: Writing out metadata
[01:39:15.292039] coredump: Finalizing
[01:39:15.292124] coredump: Writing done
[01:39:15.292128] coredump: All done (took 00s)
We can then use cuda-gdb to open the core dump file and see exactly where the kernel is hanging:
Opening GPU coredump: /tmp/cuda_coredump_hostname.3000837.1764236276
[Current focus set to CUDA kernel 0, grid 53, block (0,0,0), thread (0,0,0), device 0, sm 124, warp 0, lane 0]
#0  0x00007f2e6fbff300 in conditional_hang_kernel<<<(1,1,1),(128,1,1)>>> () at conditional_hang.py:31
31                  tl.store(x_ptr + offs, x, mask=mask)
This approach allows us to not only identify the hanging kernel (conditional_hang_kernel) but also pinpoint the exact line of code where it hangs. This represents a significant improvement over the previous situation, where identifying the problematic kernel was impossible, let alone the specific line causing the hang.
One minor inconvenience is that the core dump pipe’s path is dynamically generated by the CUDA driver, making it difficult to locate. We can address this by using the CUDA_COREDUMP_PIPE environment variable to specify a template path for the core dump pipe, allowing us to find it easily by inspecting the process’s file descriptors:
$ ls /proc/3037675/fd/ -alth | grep /tmp/cuda_coredump_pipe_
lr-x------ 1 user user 64 Nov 27 01:50 98 -> /tmp/cuda_coredump_pipe_hostname.3037675.1764237014
How to trace down the source code of a complicated kernel
In the previous blog post, we mentioned that compiling with the export NVCC_PREPEND_FLAGS='-lineinfo' environment variable embeds line information into the compiled binary, enabling us to trace down the exact line of code that caused the issue. After discussing and debugging several real-world issues, we found that the default way cuda-gdb displays line information is imperfect:
-
For some complex kernels,
cuda-gdbfails to find the correct line of code that caused the issue, even when line information is embedded in the compiled binary. -
Even when
cuda-gdbcan find the correct line of code, it only shows the last line after compiler inlining, which may not be the actual line that caused the issue. Since C++ code heavily relies on inlining to remove runtime function call overhead, we need the full inline stack to understand the issue.
Let’s illustrate this with a concrete example. The following Python script demonstrates an illegal memory access issue:
# save as illegal_memory_access.py

from dataclasses import dataclass
import torch

@dataclass
class TensorWrapper:
    data_ptr: int
    size_in_bytes: int

    @property
    def __cuda_array_interface__(self):
        return {
            "shape": (self.size_in_bytes,),
            "typestr": '|u1',
            "data": (self.data_ptr, False),
            "version": 3,
        }


def from_buffer(data_ptr: int, size_in_bytes: int, device: str, dtype: torch.dtype) -> torch.Tensor:
    return torch.as_tensor(TensorWrapper(data_ptr, size_in_bytes), device=device).view(dtype)

data = from_buffer(123456, 1024, device="cuda:0", dtype=torch.uint8)

index = torch.ones(10, device="cuda", dtype=torch.int32) + 100
print(data[index])
Run this code with PyTorch >= 2.9.0 (specifically, ensure it includes this commit; otherwise you will see an error like RuntimeError: The specified pointer resides on host memory and is not registered with any CUDA device.). This will trigger an illegal memory access error.
First, let’s run the code with CUDA core dump enabled:
CUDA_ENABLE_COREDUMP_ON_EXCEPTION=1 \
CUDA_COREDUMP_SHOW_PROGRESS=1 \
CUDA_COREDUMP_GENERATION_FLAGS='skip_nonrelocated_elf_images,skip_global_memory,skip_shared_memory,skip_local_memory,skip_constbank_memory' \
CUDA_COREDUMP_FILE="/tmp/cuda_coredump_%h.%p.%t" \
python illegal_memory_access.py
The core dump progress will explicitly identify the kernel that caused the issue:
_ZN2at6native24index_elementwise_kernelILi128ELi4EZNS0_16gpu_index_kernelIZNS0_17index_kernel_implINS0_10OpaqueTypeILi1EEEEEvRNS_18TensorIteratorBaseEN3c108ArrayRefIlEESA_EUlPcPKclE_EEvS7_SA_SA_RKT_bEUliE_EEvlT1_
From the kernel name, we can see that the issue is caused by PyTorch’s index_elementwise_kernel. To locate the exact line of code that caused the issue, we need to build PyTorch from source with the export NVCC_PREPEND_FLAGS='-lineinfo' environment variable, then run the code again.
When the compiled GPU kernel has line information embedded, we can use cuda-gdb to open the core dump file and see exactly which line of code caused the issue:
(cuda-gdb) target cudacore /tmp/cuda_coredump_flow-matic.3756036.1764250282
Opening GPU coredump: /tmp/cuda_coredump_flow-matic.3756036.1764250282
[Current focus set to CUDA kernel 0, grid 4, block (0,0,0), thread (0,0,0), device 0, sm 124, warp 3, lane 0]

CUDA Exception: Warp Illegal Address
The exception was triggered at PC 0x7ff533bb91d0  ...
#0  void at::native::index_elementwise_kernel<128, 4, at::native::gpu_index_kernel<at::native::index_kernel_impl<at::native::OpaqueType<1> >(at
::TensorIteratorBase&, c10::ArrayRef<long>, c10::ArrayRef<long>)::{lambda(char*, char const*, long)#1}>(at::TensorIteratorBase&, c10::ArrayRef<
long>, c10::ArrayRef<long>, at::native::index_kernel_impl<at::native::OpaqueType<1> >(at::TensorIteratorBase&, c10::ArrayRef<long>, c10::ArrayR
ef<long>)::{lambda(char*, char const*, long)#1} const&, bool)::{lambda(int)#1}>(long, at::native::gpu_index_kernel<at::native::index_kernel_imp
l<at::native::OpaqueType<1> >(at::TensorIteratorBase&, c10::ArrayRef<long>, c10::ArrayRef<long>)::{lambda(char*, char const*, long)#1}>(at::Ten
sorIteratorBase&, c10::ArrayRef<long>, c10::ArrayRef<long>, at::native::index_kernel_impl<at::native::OpaqueType<1> >(at::TensorIteratorBase&,
c10::ArrayRef<long>, c10::ArrayRef<long>)::{lambda(char*, char const*, long)#1} const&, bool)::{lambda(int)#1})<<<(1,1,1),(128,1,1)>>> ()
    at /data/youkaichao/pytorch/aten/src/ATen/native/cuda/IndexKernel.cu:203 in _ZZN2at6native17index_kernel_implINS0_10OpaqueTypeILi1EEEEEvRNS
_18TensorIteratorBaseEN3c108ArrayRefIlEES8_ENKUlPcPKclE_clES9_SB_l inlined from IndexKernel.cu:118
203         *reinterpret_cast<scalar_t*>(out_data) = *reinterpret_cast<const scalar_t*>(in_data + offset);
Next, within cuda-gdb, we can use info symbol $errorpc to get more information about the error location:
(cuda-gdb) info symbol $errorpc
void at::native::index_elementwise_kernel<128, 4, at::native::gpu_index_kernel<at::native::index_kernel_impl<at::native::OpaqueType<1> >(at::TensorIteratorBase&, c10::ArrayRef<long>, c10::ArrayRef<long>)::{lambda(char*, char const*, long)#1}>(at::TensorIteratorBase&, c10::ArrayRef<long>, c10::ArrayRef<long>, at::native::index_kernel_impl<at::native::OpaqueType<1> >(at::TensorIteratorBase&, c10::ArrayRef<long>, c10::ArrayRef<long>)::{lambda(char*, char const*, long)#1} const&, bool)::{lambda(int)#1}>(long, at::native::gpu_index_kernel<at::native::index_kernel_impl<at::native::OpaqueType<1> >(at::TensorIteratorBase&, c10::ArrayRef<long>, c10::ArrayRef<long>)::{lambda(char*, char const*, long)#1}>(at::TensorIteratorBase&, c10::ArrayRef<long>, c10::ArrayRef<long>, at::native::index_kernel_impl<at::native::OpaqueType<1> >(at::TensorIteratorBase&, c10::ArrayRef<long>, c10::ArrayRef<long>)::{lambda(char*, char const*, long)#1} const&, bool)::{lambda(int)#1}) + 11472 in section .text._ZN2at6native24index_elementwise_kernelILi128ELi4EZNS0_16gpu_index_kernelIZNS0_17index_kernel_implINS0_10OpaqueTypeILi1EEEEEvRNS_18TensorIteratorBaseEN3c108ArrayRefIlEESA_EUlPcPKclE_EEvS7_SA_SA_RKT_bEUliE_EEvlT1_ of /tmp/cuda-dbg/2123124/session1/elf.21407f80.24fe2940.o.4gyLzn
This provides more information about the error location. cuda-gdb unpacks the compiled binary file, and /tmp/cuda-dbg/2123124/session1/elf.21407f80.24fe2940.o.4gyLzn is a cubin file containing the index_elementwise_kernel. The error occurs at location 0x7ff533bb91d0 in the cubin file. We can use nvdisasm to disassemble the cubin file and see exactly which line of code is causing the issue:
$ nvdisasm -ndf -c -gi /tmp/cuda-dbg/2123124/session1/elf.21407f80.24fe2940.o.4gyLzn > output.txt
$ grep -C20 7ff533bb91d0 output.txt
...
        /*7ff533bb9190*/                   IMAD.IADD R19, R23, 0x1, R3 ;
.L_x_27840:
	//## File "/data/youkaichao/pytorch/aten/src/ATen/native/cuda/IndexKernel.cu", line 203 inlined at "/data/youkaichao/pytorch/aten/src/ATen/native/cuda/IndexKernel.cu", line 118
	//## File "/data/youkaichao/pytorch/aten/src/ATen/native/cuda/IndexKernel.cu", line 118 inlined at "/data/youkaichao/pytorch/aten/src/ATen/native/cuda/IndexKernel.cu", line 37
	//## File "/data/youkaichao/pytorch/aten/src/ATen/native/cuda/IndexKernel.cu", line 37
        /*7ff533bb91a0*/                   ULDC.64 UR4, c[0x0][0x480] ;
        /*7ff533bb91b0*/                   IADD3 R2, P0, P1, R22, UR4, R2 ;
        /*7ff533bb91c0*/                   IADD3.X R3, R19, UR5, RZ, P0, P1 ;
        /*7ff533bb91d0*/                   LDG.E.U8 R3, desc[UR36][R2.64] ;
...
Now we can see the full inline stack of the code that caused the issue. By default, cuda-gdb only shows the last inline expansion.
A brief explanation of the command:
-ndf: Disable dataflow analyzer after disassembly.-c: Only print code sections.-gi: Annotate disassembly with source line information obtained from .debug_line section along with function inlining info, if present.-C20: agrepargument showing 20 lines of context around the found Program Counter address7ff533bb91d0.
If the cubin file contains multiple kernels with the same Program Counter address (i.e., grep shows multiple matches), we need to further filter the information:
$ cuobjdump -elf /tmp/cuda-dbg/2123124/session1/elf.21407f80.24fe2940.o.4gyLzn > elf.txt
$ cat elf.txt | grep ".text._ZN2at6native24index_elementwise_kernelILi128ELi4EZNS0_16gpu_index_kernelIZNS0_17index_kernel_implINS0_10OpaqueTypeILi1EEEEEvRNS_18TensorIteratorBaseEN3c108ArrayRefIlEESA_EUlPcPKclE_EEvS7_SA_SA_RKT_bEUliE_EEvlT1_" | grep PROGBITS

  1ac 1b83f80   b200  0 80                     PROGBITS        6    3      26a .text._ZN2at6native24index_elementwise_kernelILi128ELi4EZNS0_16gpu_index_kernelIZNS0_17index_kernel_implINS0_10OpaqueTypeILi1EEEEEvRNS_18TensorIteratorBaseEN3c108ArrayRefIlEESA_EUlPcPKclE_EEvS7_SA_SA_RKT_bEUliE_EEvlT1_

$ nvdisasm -ndf -c -gi -fun 0x26a /tmp/cuda-dbg/2123124/session1/elf.21407f80.24fe2940.o.4gyLzn > output.txt
$ grep -C20 7ff533bb91d0 output.txt
...
        /*7ff533bb9190*/                   IMAD.IADD R19, R23, 0x1, R3 ;
.L_x_27840:
	//## File "/data/youkaichao/pytorch/aten/src/ATen/native/cuda/IndexKernel.cu", line 203 inlined at "/data/youkaichao/pytorch/aten/src/ATen/native/cuda/IndexKernel.cu", line 118
	//## File "/data/youkaichao/pytorch/aten/src/ATen/native/cuda/IndexKernel.cu", line 118 inlined at "/data/youkaichao/pytorch/aten/src/ATen/native/cuda/IndexKernel.cu", line 37
	//## File "/data/youkaichao/pytorch/aten/src/ATen/native/cuda/IndexKernel.cu", line 37
        /*7ff533bb91a0*/                   ULDC.64 UR4, c[0x0][0x480] ;
        /*7ff533bb91b0*/                   IADD3 R2, P0, P1, R22, UR4, R2 ;
        /*7ff533bb91c0*/                   IADD3.X R3, R19, UR5, RZ, P0, P1 ;
        /*7ff533bb91d0*/                   LDG.E.U8 R3, desc[UR36][R2.64] ;
...
The main difference is obtaining the CUDA function index (the -fun argument) from cuobjdump by searching the function’s ELF section, which is 26a in this case.
Note that this is a simplified example to demonstrate the technique. Real-world kernels can be much more complex. For example, here is a complex inline case:
	//## File "/data/youkaichao/data/vllm_flash_attn/csrc/cutlass/include/cute/arch/copy_sm90.hpp", line 93 inlined at "/data/youkaichao/data/vllm_flash_attn/csrc/cutlass/include/cute/arch/util.hpp", line 158
	//## File "/data/youkaichao/data/vllm_flash_attn/csrc/cutlass/include/cute/arch/util.hpp", line 158 inlined at "/data/youkaichao/data/vllm_flash_attn/csrc/cutlass/include/cute/arch/util.hpp", line 185
	//## File "/data/youkaichao/data/vllm_flash_attn/csrc/cutlass/include/cute/arch/util.hpp", line 185 inlined at "/data/youkaichao/data/vllm_flash_attn/csrc/cutlass/include/cute/atom/copy_traits.hpp", line 133
	//## File "/data/youkaichao/data/vllm_flash_attn/csrc/cutlass/include/cute/atom/copy_traits.hpp", line 133 inlined at "/data/youkaichao/data/vllm_flash_attn/csrc/cutlass/include/cute/atom/copy_atom.hpp", line 103
	//## File "/data/youkaichao/data/vllm_flash_attn/csrc/cutlass/include/cute/atom/copy_atom.hpp", line 103 inlined at "/data/youkaichao/data/vllm_flash_attn/csrc/cutlass/include/cute/atom/copy_atom.hpp", line 124
	//## File "/data/youkaichao/data/vllm_flash_attn/csrc/cutlass/include/cute/atom/copy_atom.hpp", line 124 inlined at "/data/youkaichao/data/vllm_flash_attn/csrc/cutlass/include/cute/algorithm/copy.hpp", line 211
	//## File "/data/youkaichao/data/vllm_flash_attn/csrc/cutlass/include/cute/algorithm/copy.hpp", line 211 inlined at "/data/youkaichao/data/vllm_flash_attn/csrc/cutlass/include/cute/algorithm/copy.hpp", line 412
	//## File "/data/youkaichao/data/vllm_flash_attn/csrc/cutlass/include/cute/algorithm/copy.hpp", line 412 inlined at "/data/youkaichao/data/vllm_flash_attn/hopper/epilogue_fwd.hpp", line 265
	//## File "/data/youkaichao/data/vllm_flash_attn/hopper/epilogue_fwd.hpp", line 265 inlined at "/data/youkaichao/data/vllm_flash_attn/hopper/flash_fwd_kernel_sm90.h", line 454
	//## File "/data/youkaichao/data/vllm_flash_attn/hopper/flash_fwd_kernel_sm90.h", line 454 inlined at "/data/youkaichao/data/vllm_flash_attn/hopper/utils.h", line 41
	//## File "/data/youkaichao/data/vllm_flash_attn/hopper/utils.h", line 41 inlined at "/data/youkaichao/data/vllm_flash_attn/csrc/cutlass/include/cutlass/device_kernel.h", line 122
	//## File "/data/youkaichao/data/vllm_flash_attn/csrc/cutlass/include/cutlass/device_kernel.h", line 122
        /*7eebf5e9eb80*/                   STSM.16.M88.4 [R13], R4 ;
        /*7eebf5e9eb90*/                   MOV R34, R26 ;
In this case, the problematic code is:
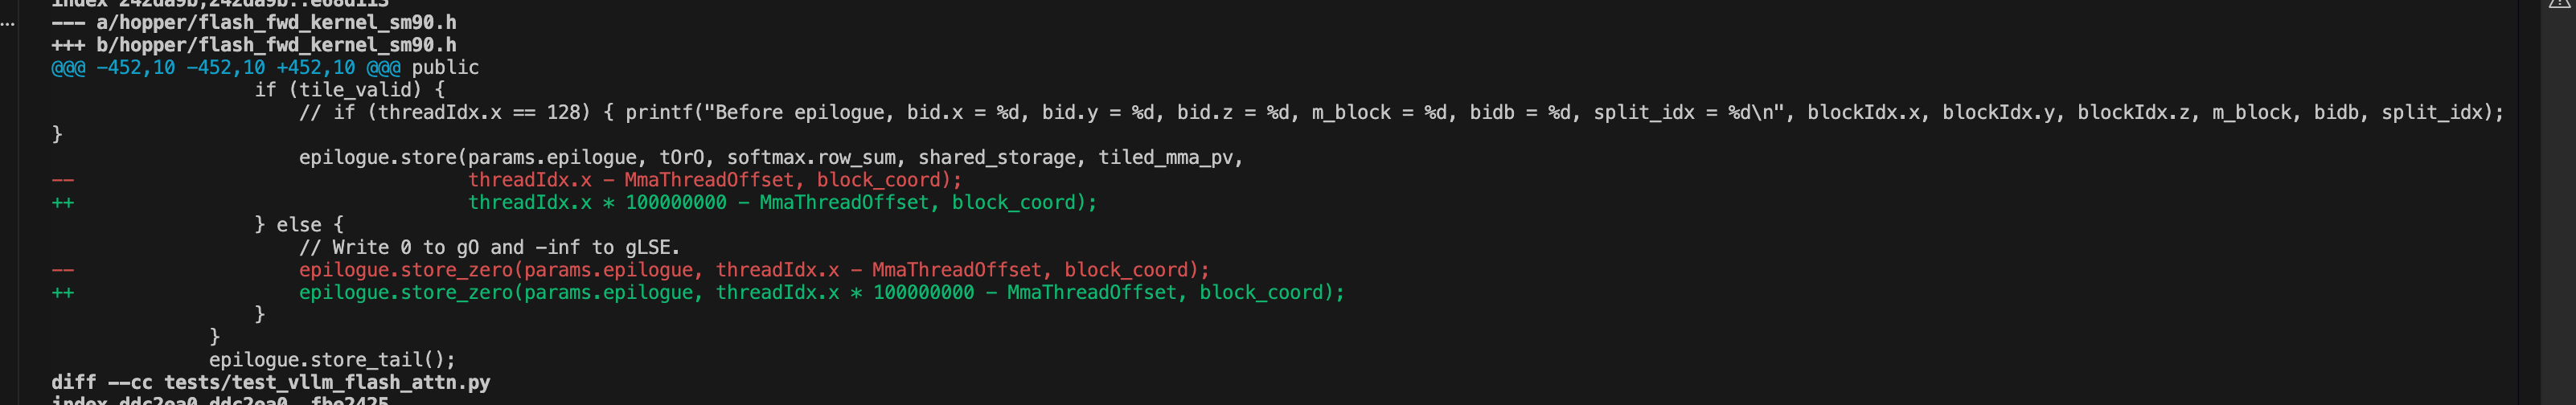
A line of poisoned code in the attention kernel.
The faulty source code calls some CUTLASS functions, and the function containing it also gets inlined by an upper-level caller. In this case, cuda-gdb cannot correctly associate the line. In fact, it does not show any line information around the error location. Even when it shows the correct line, it only displays the last inline frame, which is File "/data/youkaichao/data/vllm_flash_attn/csrc/cutlass/include/cute/arch/copy_sm90.hpp", line 93 inlined at "/data/youkaichao/data/vllm_flash_attn/csrc/cutlass/include/cute/arch/util.hpp", line 158—an internal inline expansion of the CUTLASS function that is still unhelpful for debugging the underlying issue.
With the approach outlined above, we can uncover the full inline chain of the source code and carefully examine each frame to identify which line is responsible for the error.
Warning: To maximize the benefit of CUDA core dumps, line information is crucial. It is recommended to compile with the export NVCC_PREPEND_FLAGS='-lineinfo' environment variable, as this transparently applies to all compiled kernels without needing to modify compilation scripts. However, this transparency means that if you use a compilation caching mechanism such as ccache, it may ignore the flag and reuse previously compiled results without actual compilation. When compiling from source, ensure that the compilation caching mechanism is disabled. If you use Just-In-Time compilation, please consult the documentation of your Just-In-Time compilation tool to see how to add line information.
Conclusion
This blog post introduced two advanced debugging techniques for CUDA kernels. The first technique uses user-triggered core dumps to identify hanging kernels, while the second traces complex kernels back to their source code by leveraging line information embedded in the compiled binary. These techniques are powerful tools for debugging complex issues in CUDA kernels, especially illegal memory access problems. Using both in tandem we were able to recently debug a hard-to-reproduce and tricky hang in the CUTLASS MLA attention backend, which actually stemmed from the upstream CUTLASS code example and has since been fixed in v4.3.0.
The vLLM project aims to provide easy, fast, and affordable LLM serving for everyone, and accessible debugging is an important aspect of this mission. We will continue to share more debugging tips and techniques in the future to build a strong LLM inference ecosystem together. To share your story or usage with vLLM, please submit a PR at the blogpost repository.
Acknowledgement
We would like to thank Ze Long and Sandarbh Jain from NVIDIA for their helpful discussions. Chao Hong from Moonshot AI helped provide the motivating example. Lucas Wilkinson from Red Hat helped polishing the draft.